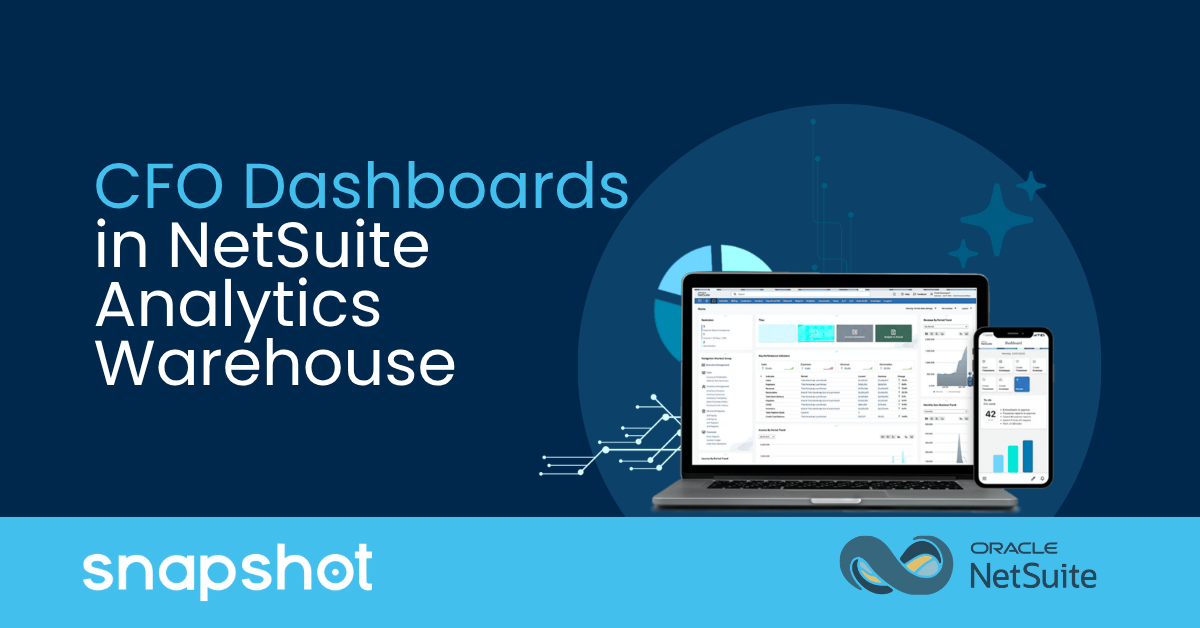
A NetSuite Analytics Warehouse (NSAW) CFO dashboard is a role-specific financial reporting environment built on top of NSAW's dedicated analytics layer, giving finance leaders consolidated visibility into the metrics that drive decisions without the performance constraints or data limitations of native NetSuite reporting. For manufacturers and distributors managing multiple entities, subsidiaries, or data sources, NSAW gives CFOs the consolidated financial visibility that native reporting was not built to provide.
Snapshot has worked as a NetSuite Alliance Partner for more than 12 years helping finance teams get the most out of their NetSuite system. This post covers where native reporting falls short, what a well-configured CFO dashboard in NSAW contains, and what it takes to build your dashboards correctly.
Where Does Native NetSuite Reporting Hit Its Limits?
NetSuite's native reporting tools, including saved searches, financial reports, and SuiteAnalytics Workbook, are built for operational visibility. They give finance teams current access to transactional data and work well for day-to-day reporting needs. The limits of these tools are revealed when CFO-level analysis requires something deeper: large-scale historical trend analysis, cross-subsidiary financial consolidation, or queries that combine data from multiple record types and external systems:
- Saved searches that work efficiently for operational queries can time out or return incomplete results when run against large transaction histories.
- Cross-subsidiary consolidation in native NetSuite typically requires manual export and assembly in Excel, introducing both latency and the risk of reconciliation errors.
- SuiteAnalytics runs queries directly against the live NetSuite database, meaning complex analytical workloads compete with transaction processing for system resources.
NSAW addresses these constraints by separating the analytics layer from the operational database entirely. Financial data is replicated into a dedicated Oracle Autonomous AI Lakehouse environment where large-scale queries, historical trend analysis, and multi-source data consolidation run without impacting production performance.
What Should a CFO Dashboard in NSAW Contain?
The most important dashboards for CFOs at manufacturing and distribution companies fall into four categories. Each addresses a different dimension of financial performance and draws on NSAW's ability to consolidate and analyze data at a depth that native reporting cannot match consistently:
Budget vs. Actual
Budget vs. actual is the dashboard most CFOs open first. In NSAW, it pulls actuals directly from the NetSuite general ledger and compares them against budget data at the department, subsidiary, and account level, with variance calculated in both absolute dollars and percentage terms. In contrast to native reporting, NSAW enables you to run this analysis across multiple subsidiaries simultaneously and drill from the variance summary down to the transaction level without hitting performance limits. For manufacturers and distributors managing multiple cost centers or business units, that drill-through capability converts a summary view into an actionable view.
Cash Flow and Working Capital
Cash flow visibility at the CFO level requires more than a snapshot of the current cash balance. A well-configured NSAW cash flow dashboard shows operating cash flow trends over a rolling period, cash inflows and outflows by category, and working capital components including accounts receivable, accounts payable, and inventory positions. For distributors managing extended payment terms or seasonal inventory builds, the ability to see cash conversion cycle trends over time rather than point-in-time balances gives the CFO the forward visibility needed to make financing and procurement decisions before a liquidity constraint emerges.
Gross Margin by Segment
Generating gross margin analysis at the segment level is difficult through NetSuite saved searches. Combining revenue, cost of goods sold, and margin calculations across product lines, customer segments, or geographic regions requires joining multiple record types in ways that saved searches struggle to handle at scale. NSAW's prebuilt datasets and dimensional data model are designed to handle these joins at analytical scale, allowing CFOs to analyze margin trends by segment over time and identify where profitability is compressing before it shows up in aggregate financials.
DSO and AR Aging
Days Sales Outstanding and AR aging are leading indicators of cash flow risk. A CFO who monitors only the current AR aging snapshot risks missing key trends. NSAW tracks DSO trends over time and presents AR aging analysis by customer, subsidiary, and aging bucket in a format designed for executive review rather than collections team operations. For manufacturers and distributors with high invoice volumes and extended payment terms, that trend visibility is material to how the CFO manages working capital.
How Does NSAW Handle Multi-Source and Multi-Subsidiary Data?
The CFO dashboards described above cover NetSuite financial data. NSAW separates itself further from native reporting through its ability to incorporate data from systems outside NetSuite and consolidate financial information across subsidiaries without manual export.
Non-NetSuite data sources, including CRM platforms, ecommerce systems, and external databases, can be connected to NSAW and blended with NetSuite financial data in a unified reporting environment. For a CFO who needs to see the relationship between pipeline data and revenue actuals, or between ecommerce order volume and gross margin performance, NSAW removes the manual assembly work that typically happens in Excel between systems that do not talk to each other.
Multi-subsidiary financial reporting is a core NSAW use case. The analytics environment supports subsidiary-level reporting, currency conversion, and consolidated views. Intercompany elimination logic requires configuration beyond the base Financials Foundation templates and is defined during implementation to reflect the organization's specific entity structure. For manufacturers and distributors operating across multiple entities, this is one of the highest-value capabilities NSAW delivers relative to what native NetSuite reporting supports.
How Should You Configure CFO Dashboards in NSAW?
NSAW includes Financials Foundation templates that cover commonly used CFO reporting views as a starting point, including budget vs. actual, financial statements, and cash flow summaries. Getting CFO dashboards from the template baseline to a configuration that a finance leader will rely on requires several decisions and steps that determine whether the output is accurate and usable.
Chart of accounts alignment is typically the first configuration task. NSAW's prebuilt datasets map to standard NetSuite account structures, but organizations with customized charts of accounts, intercompany accounts, or non-standard segment structures need those mappings validated before dashboard output can be trusted.
KPI definition is the second area where implementation experience matters. The metrics on a CFO dashboard must match how the finance team defines them:
- Gross margin calculations that align with the company's costing methodology.
- DSO calculations that reflect the correct invoice date basis.
- Budget vs. actual variance that uses the right budget version.
Dashboard design is the final layer. NSAW's Oracle Analytics Cloud interface supports a wide range of visualization types and role-based access configurations. Dashboards should be designed around the CFO's actual decision workflow, with the highest-priority metrics above the fold and drill-through paths that follow the natural flow from summary to transaction.
Looking to Get More from Your NetSuite Investment?
NSAW CFO dashboards extend native NetSuite reporting into the analytical territory it was not built to cover reliably: multi-subsidiary consolidation, historical trend analysis at scale, and cross-source financial visibility that a CFO can trust without manual assembly.
With more than 12 years as a NetSuite Alliance Partner, Snapshot helps manufacturers and distributors configure NSAW environments and optimize the financial workflows that deliver the financial clarity their leadership teams need.

 Michael Rueda
 Michael Rueda : Oct 2, 2026, 8:00:00 AM